Profile Image
  •     -Registered Professional Engineer
  •     -Data Scientist
  •     -Python, Excel, PowerQuery, SQL

Welcome to my portfolio! I am continuing to add exciting personal projects that I work on in my spare time. I have been 1.5 miles underground vertically into the earth and guess what I found? Data, data, and more data! Most of my career as an engineer has been spent working under confidentiality agreements. I am a registered Professional Engineer (NC, FL, and LA) and data scientist with 11+ years of demonstrated success utilizing a diverse set of software suites and technologies to design, implement, and analyze operational and engineering data in mining, civil, and environmental applications.

Want to Collab? Great! I have a strong background of research, production, engineering, consulting, and customer service which enables me to analyze complex problems, develop and implement solutions, evaluate the process with measurable parameters, develop content, and present findings to all technical levels. Let's get the job done.

Projects

Thumbnail 2
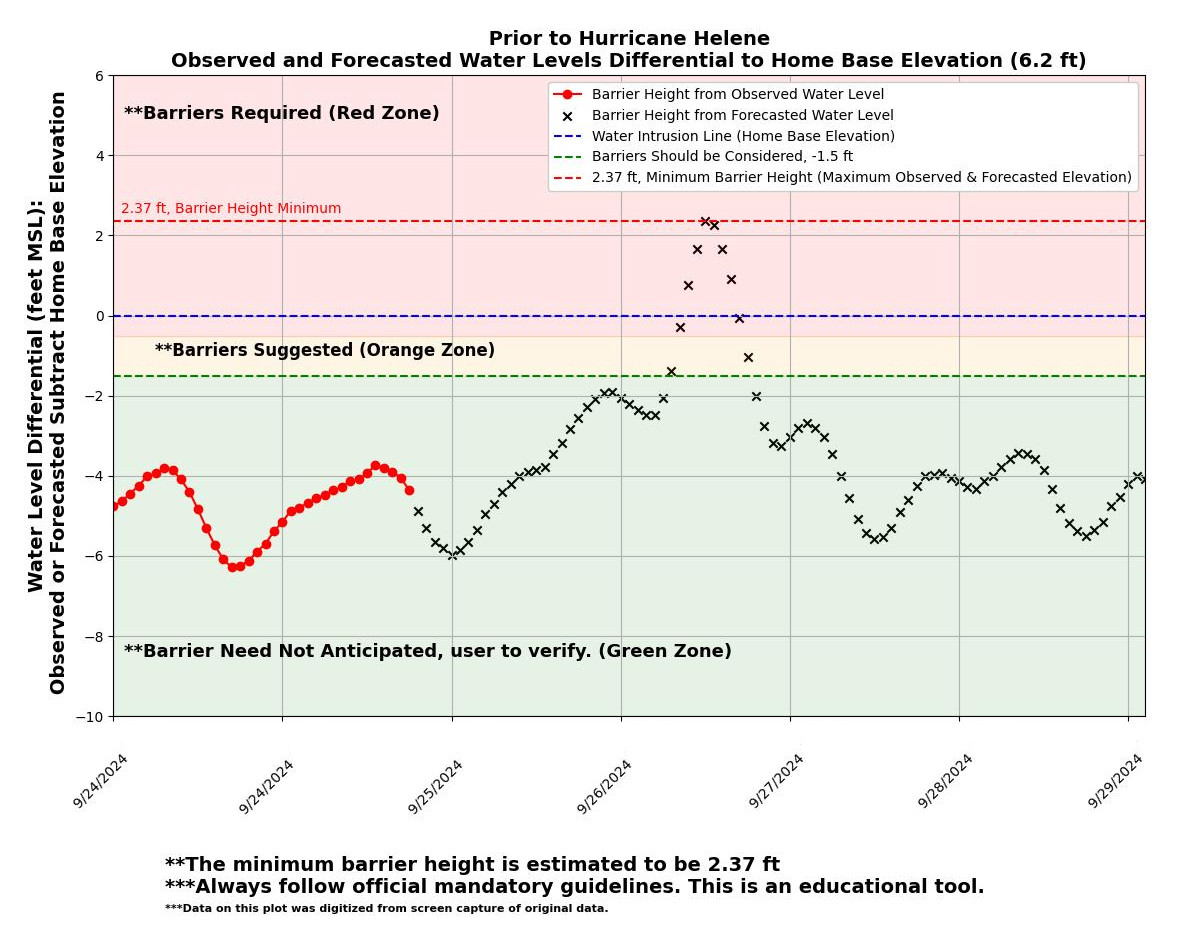
Defend Your Home Against Hurricanes Using Data Science
-Find the Minimum Barrier Height Required For Surge Events by Analyzing the NOAA Extratropical Water Level Guidance.
-My home experienced 16-19” of surge surrounding the entire exterior perimeter during Hurricane Helene. However, my home experienced 500-900% less total interior water height compared to my immediate neighbors by utilizing readily available materials. -Barrier Height Tool is python educational tool that outputs graphical and text suggestions for the minimum barrier height. Data 37 hours prior was 0.9 feet within actual water level experience.
Thumbnail 2
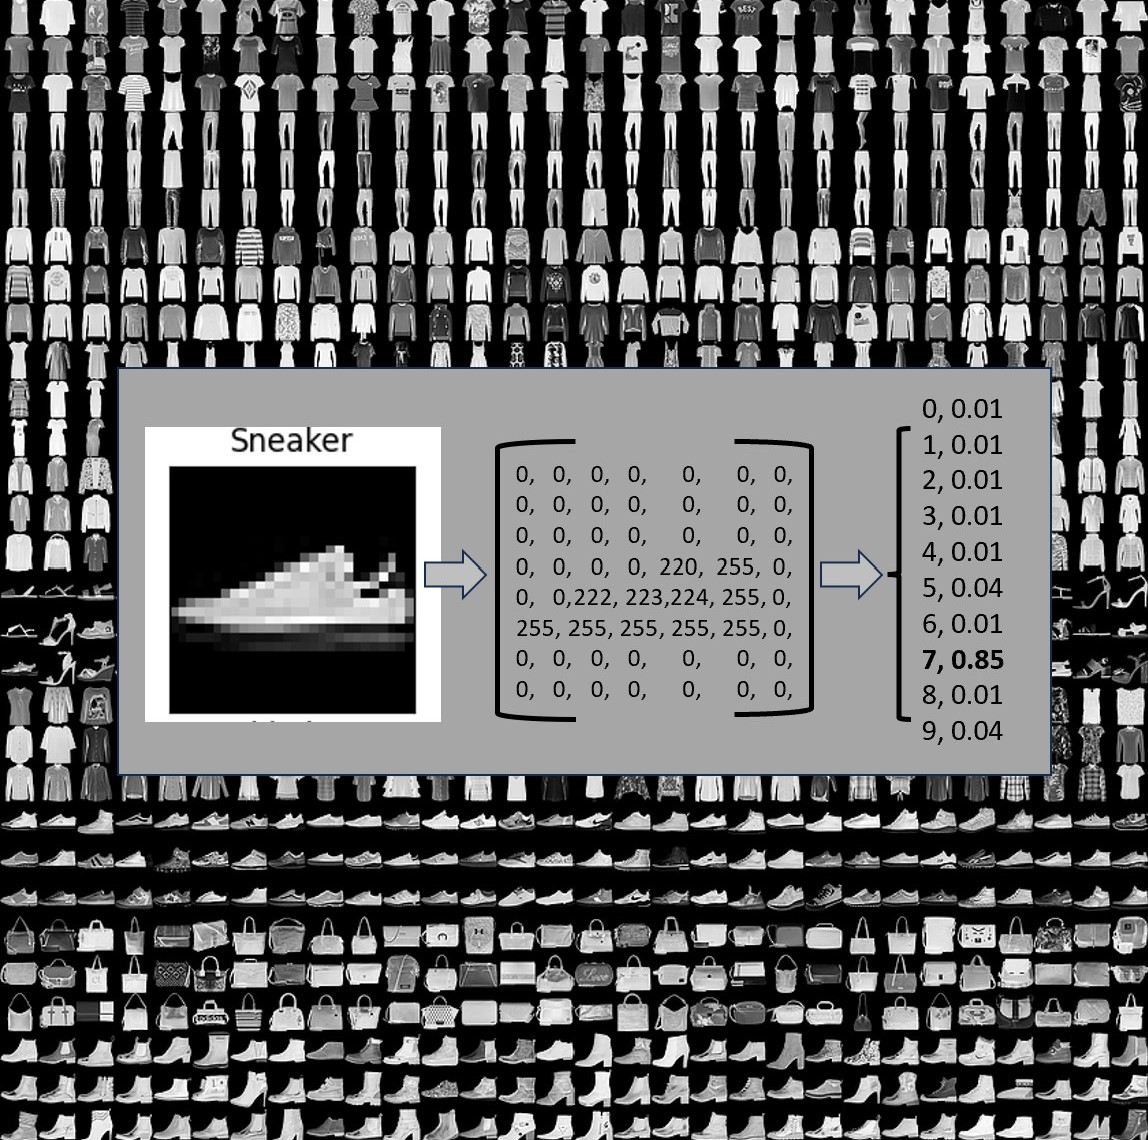
Image Classification with the Fashion-MNIST Dataset - Neural Network vs. Convolutional Neural Network
-Demonstrates image classification of the Fashion-MNIST dataset using Tensorflow Keras Neural Network and a Convolutional Neural Network (CovNet or CNN) in a python jupyter notebook.
-The Fashion-MNIST dataset was loaded from Keras for this exercise.
-The neural network was determined to have an accuracy of ~88% versus the convolutional neural network accuracy of ~91%.
Thumbnail 2
Identifying Abnormal Rhythms on Electrocardiograms
-Identifying Abnormal Rhythms on Electrocardiograms with Keras Tensorflow in a python jupyter notebook.
-A simplified version of the ECG5000 Electrocardiograms full dataset was reviewed in this exercise.
-The neural network was determined to have an accuracy of 98.9% with 100 epochs. The number of epochs can be adjusted to further optimize the model. A baseline model comparison would be always selecting 0 for every point (41%) or selecting 1 for every point (58%). This model can be used to inspect future Electrocardiograms.
Thumbnail 1
Claire's PAW Tracker
-Breathing rate tracking is critical for pets with cardiac issues. Provides tools to track, visualize, and analyze your pet's breathing rate trends over time. The tables and graphs can be printed and provided to your veterinarian to aid with treatment.
-Anyone can use these free tools to monitor your pet as well! Record date, time, breaths per minute.
-Breathing rates over 40 per minute or significantly greater than normal can indicate immediate medical attention is required. We identified Claire needed medical attention on 9/16 using her PAW Tracker.
-The tools are written in Python and Excel.
Thumbnail 2
Analyzing Diabetes with XGBoost
-Analyze diabetes dataset utilizing XGBoost in a python jupyter notebook.
-This diabetes dataset contains the variables pregnancies, glucose, blood pressure, skin thickness, insulin, BMI, diabetes pedigree function, age, and outcome (binary- positive or negative).
-Most important features identified as glucose, BMI, and age.
Thumbnail 2
Amusement Park Attendance with Classification and Regression Trees
-Amusement park attendance data utilizing classification and regression trees in a python jupyter notebook.
-This dataset contains the variables attendees, month, day, hour, day_of_week, holiday, temp, temp_wb, rel_humidity, windspeed, and precipitation.
-Linear Regression model has an OSR2 value of 69.4%, while a decision tree with 11,321 nodes had 100% accuracy (overfitting) on the training dataset.
-Tree pruning was completed to identify a tree model with 751 nodes and a max tree depth of 29. The plots show the basic classification tree with a 79.7% OSR2 value.
Thumbnail 4
FICO Credit Score Logistic Regression Model to Predict Loan Defaults
-A logistic regression model is created to determine whether a customer will default on their loan based on their FICO credit score.
-The customer loan dataset consists of 9,516 rows and 7 columns. The seven columns are: default, installment, log_income, fico_score, rev_balance, inquiries, and records.
-The logistic regression model was determined to have an 82.8% accuracy of predicting whether a customer will default on their loan by using their FICO Credit Score in the test dataset. Please see confusion matrix and heatmaps for results.
Thumbnail 4
OLS Linear Regression Model Based on the NCSU.EDU Diabetes Dataset
-Explores the NCSU.EDU Diabetes Dataset with an OLS Linear Regression Model. The Linear Regression Model is Used to Predict the Progression of Diabetes One Year after the Baseline.
-The dataset contains ten baseline variables, for each of n = 442 diabetes patients, as well as the response of interest, a quantitative measure of disease progression one year after baseline.
-The OLS Linear Regression model using all ten baseline variables showed several variables that were statistically insignificant. The second OLS Linear Regression model with sex, bmi, s3, and s5 yielded the best results with a 48.5% out of sample r-squared value.
Thumbnail 4
Automobile Survey Clustering, Dendrograms, and Principal Component Analysis
-The objective of this exercise examines Auto Survey data that contains reviews of different features of an automobile.
-The data consists of yes or no questions (1 or 0) for whether the automobile satisfies each category (variable).
-The heat map showed Power is the most correlated feature to "Sporty." The K-Means clustering showed the Driving Priorities, Technology, and Power features contribute to a customer falling into the same cluster. The analysis found reliability is more important than comfort. Technology is more important than interior. Most people who took the survey were male.
Thumbnail 4
Airline Customer Data Clustering to Identify Similar Customers with K-Means
-Airline customer data is utilized to identify similar customer clusters with the Scikit-Learn K-Means algorithm.
-The artificial data contains how many months the Customer Account has been active and the Current Mileage Balance reward points.
-The visual elbow method is used to determine the ideal number of clusters (k) for this exercise. The points and clusters are plotted for Airline Customer AccountAge vs Mileage Balance.
-Similar data could be processed through this methodology in order to identify similar data points as well as anomalies.
Thumbnail 4
Exploring Covariance of Randomly Generated Data and Sales Data with Numpy.
-Explore the covariance of randomly generated data, as well as sales data in a python jupyter notebook.
-The random data is generated with the random library. The sales data is imported from a csv file and contains total daily advertising spend and the total daily sales ($).
-The positive covariance indicates the variables tend to move in the same direction. This means that when more was spent on advertising, the total daily sales incrased.
Thumbnail 2
Estimating a Physician's Schedule using a Binomial Distribution
-The objective of this project is to estimate the number of appointments a physician should schedule in order to maximize the number of patients given 25% of patients will not show up in a python jupyter notebook.
-The exercise first considers a linear approach, followed by a binomial distribution in order to maximize the number of appointments. The number of patients that should be scheduled considers the physician can see a maximum of 30 patients per day and the probability that a patients will show up is 75%.
-The binomial ppf() function is used to calculate that 34.0 appointments can be scheduled to limit the risk of having more than 30 appointments per day to 5%.
Thumbnail 3
Coming Soon...
Neural Networks
Deep Learning
TensorFlow
Optimization

Skills

Virginia Tech, Mining Engineering - Ph.D. (2013), M.S. (2009), and B.S. (2007)
MIT xPRO Professional Certificate in Data Science and Analytics (Jan-Aug 2024)

My skill set spans a range of technical proficiencies including:

  • Skillset: Python, PowerQuery, Excel, SQL
  • Python: Jupyter notebooks, Pandas, Scikit-Learn, NumPy, Matplotlib, Seaborn, Plotly, XGBoost, Random Forest, TensorFlow, Keras, statsmodels, SciPy, math, and skimpy.
  • Web Development: HTML, CSS

Contact

Please feel free to reach out through the following platforms: