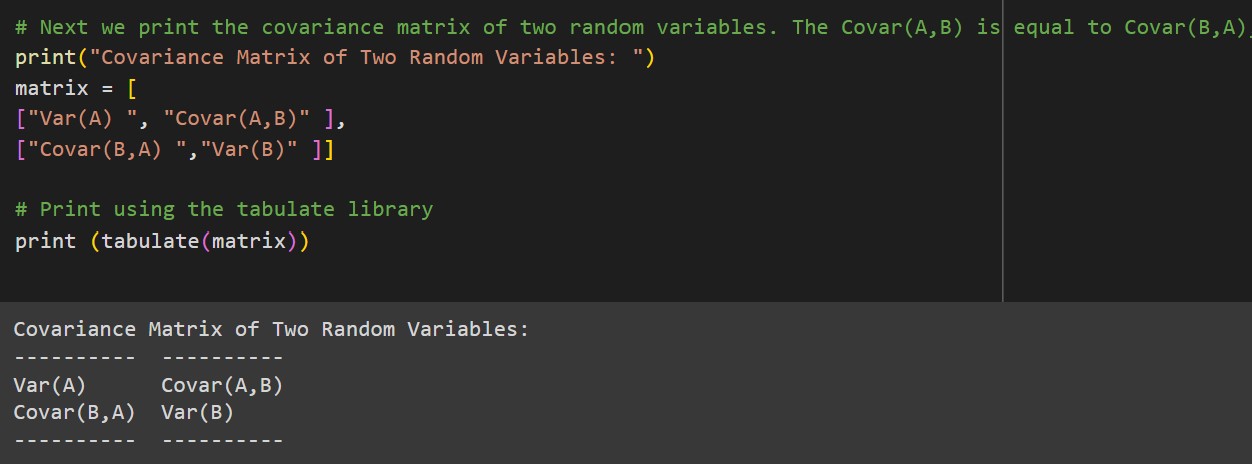
Exploring Covariance of Randomly Generated Data and Sales Data with Numpy.
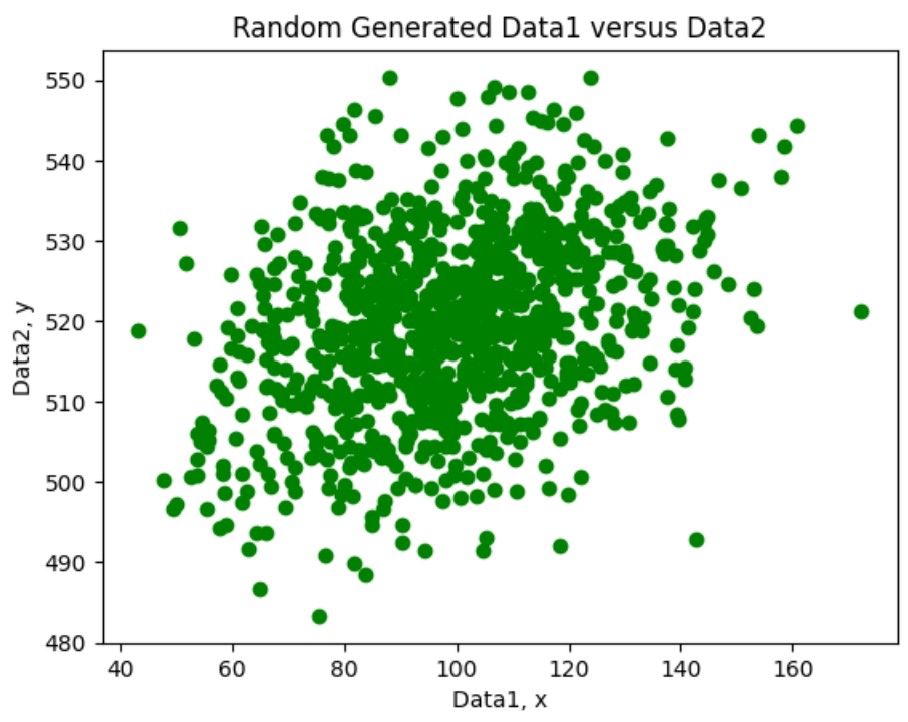
- The objective of this project is to explore the covariance of randomly generated data, as well as sales data in a python jupyter notebook.
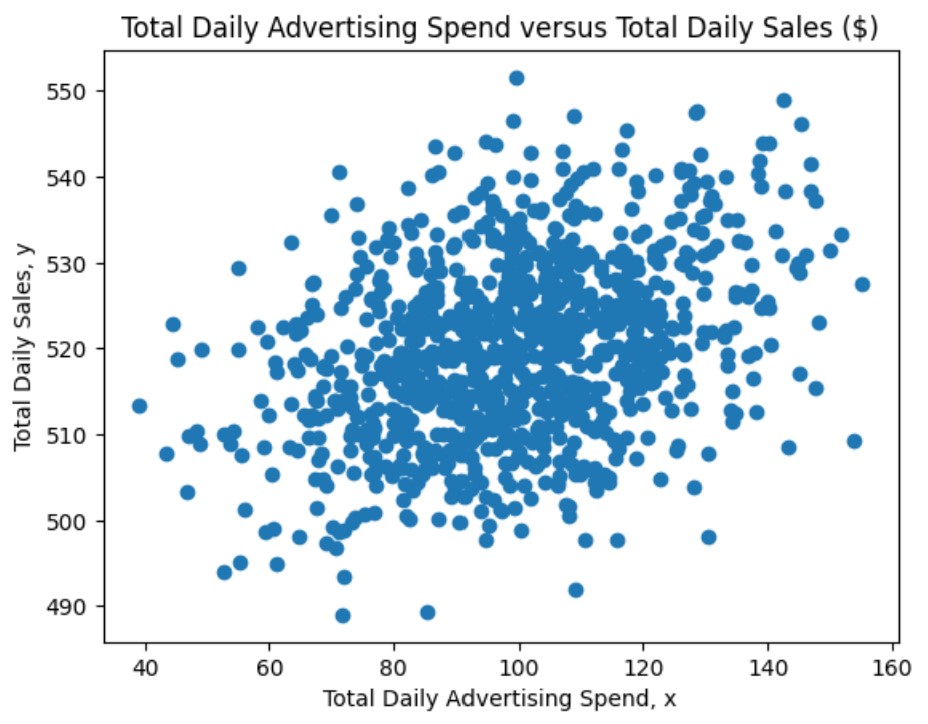
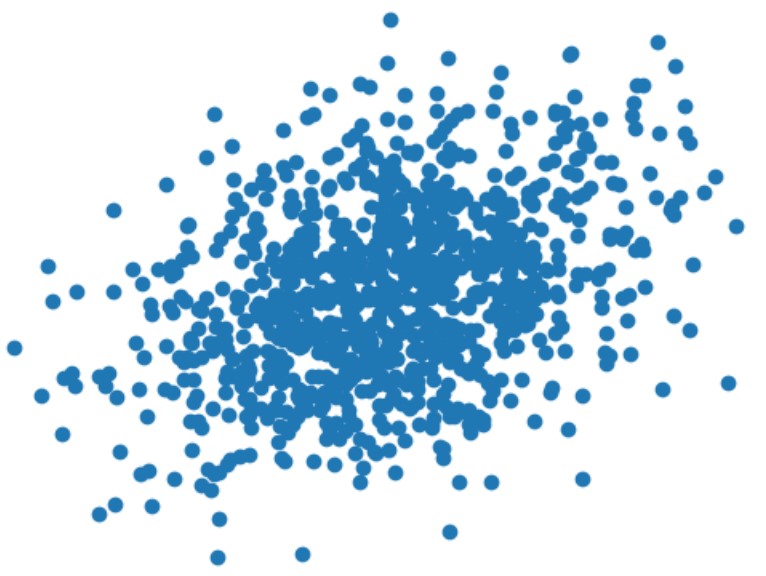
- The random data is generated with the random library. The sales data is imported from a csv file and contains total daily advertising spend and the total daily sales ($).
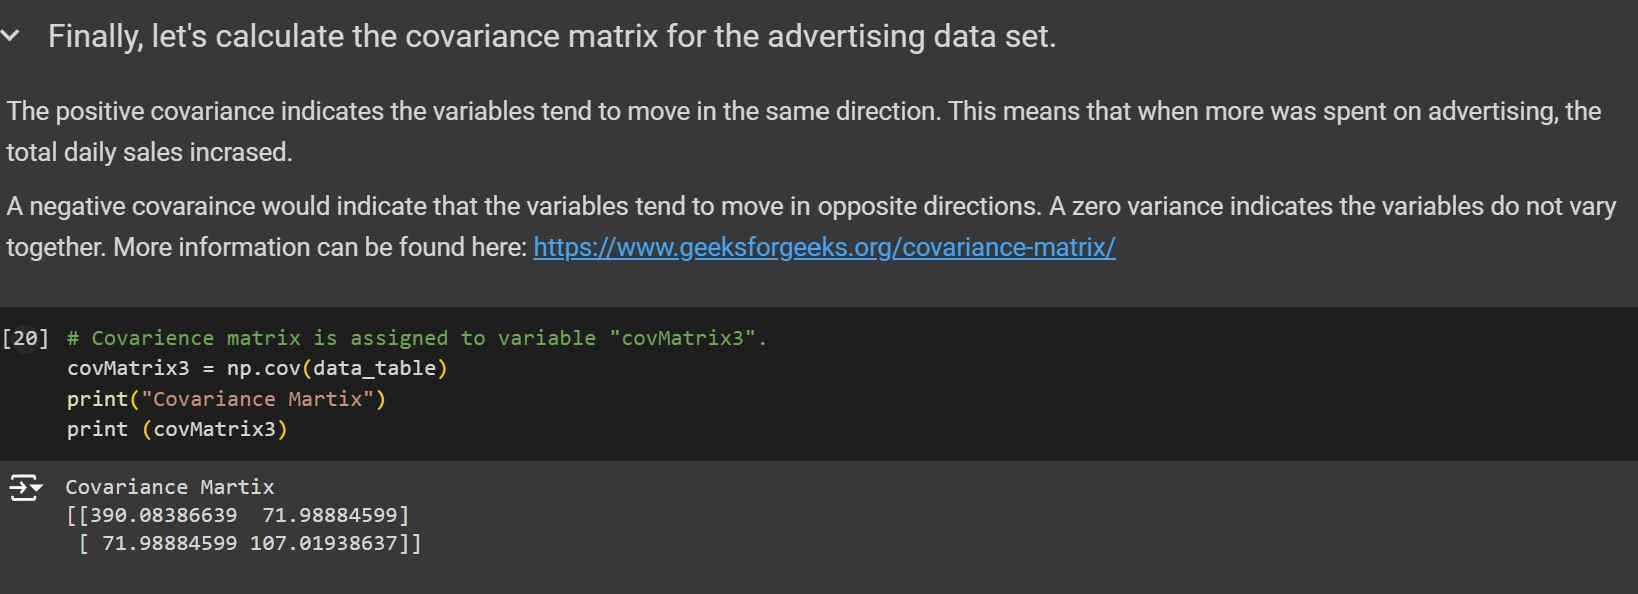
- The positive covariance indicates the variables tend to move in the same direction. This means that when more was spent on advertising, the total daily sales incrased.
- Tables and graphs can be found here: Exploring Covariance of Randomly Generated Data and Sales Data with Numpy Python Jupyter Notebook