Profile Image
  • Methods: Python
  • Data Analysis: Pandas, Numpy
  • Data Visualization: Matplotlib
  • Data Modeling: sklearn, DecisionTreeRegressor/Classification
  • Web Development: HTML, CSS

Amusement Park Attendance data utilizing Classification and Regression Trees

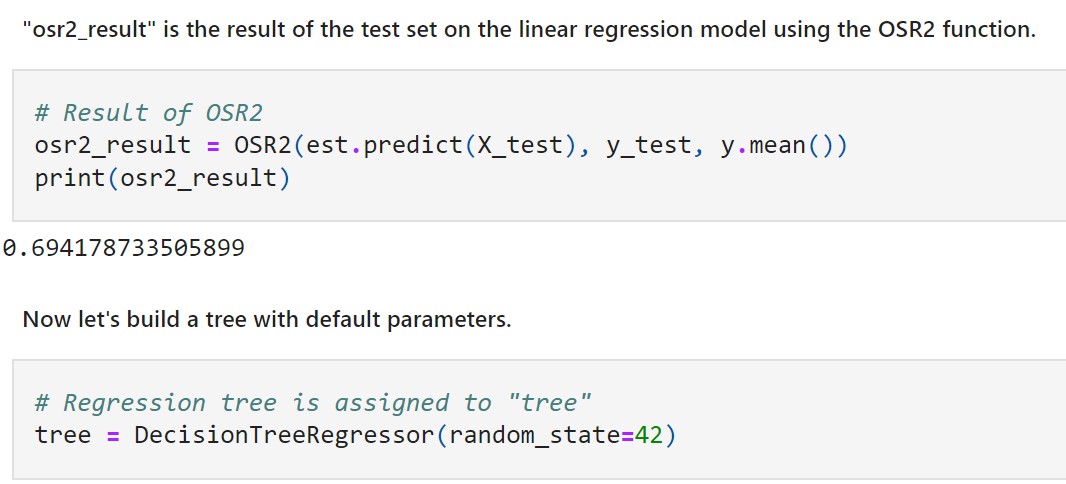
  • The objective of this project is to evaluate amusement park attendance with a linear regression model, as well as Classification and Regression Trees in a python jupyter notebook.
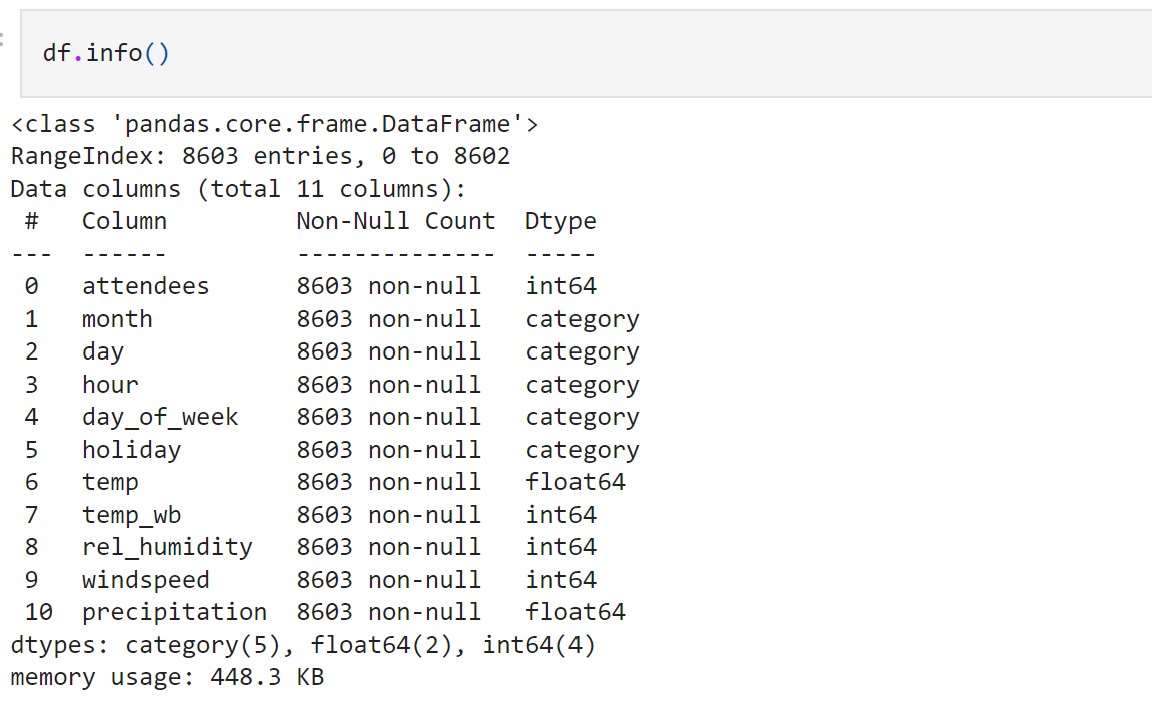
  • The amusement park dataset contains the variables attendees, month, day, hour, day_of_week, holiday, temp, temp_wb, rel_humidity, windspeed, and precipitation.
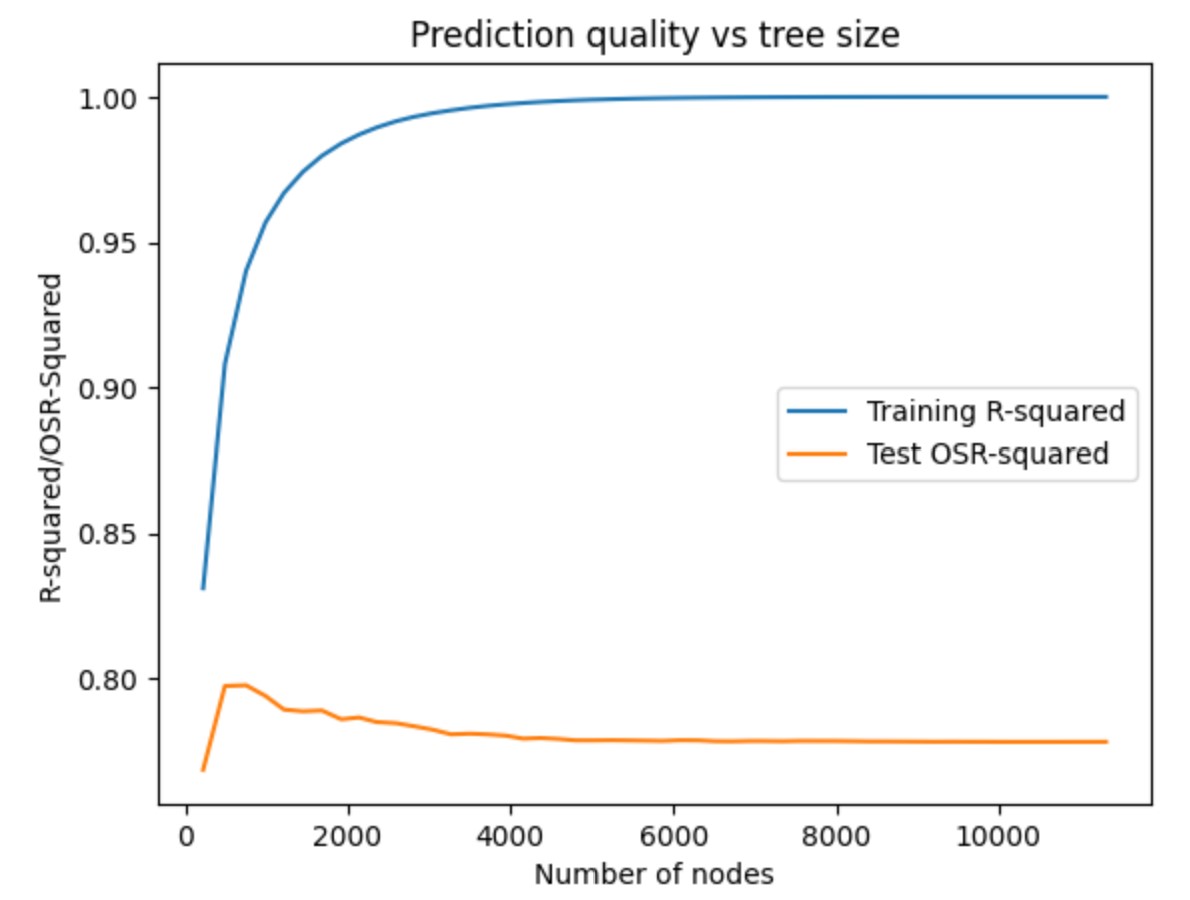
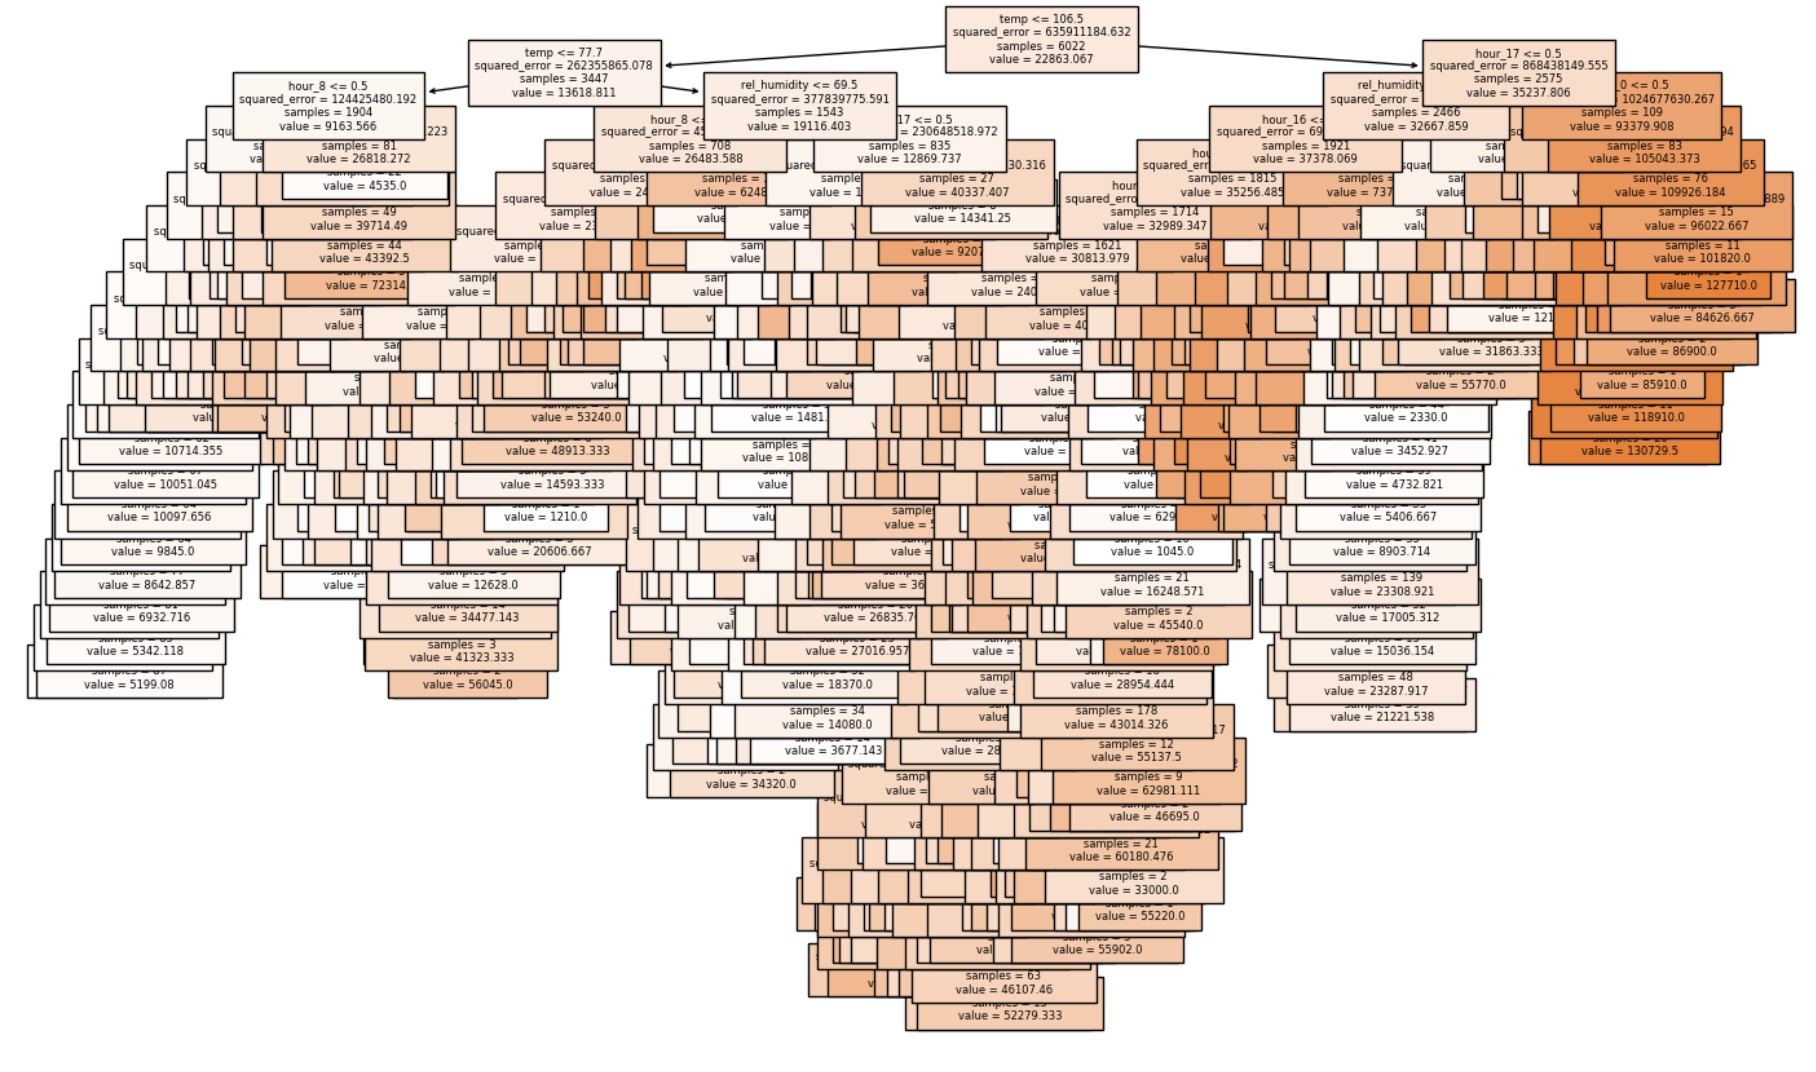
  • Decision Trees are a non-parametric supervised learning method for classification that creates a model to predict the value of a target variable (attendance) by learning simple decisions/rules (Scikit-learn.org).
  

Results

The dataset analyzed in this project includes 8,603 entries, which include the variables attendees, month, day, hour, day_of_week, holiday, temp, temp_wb, rel_humidity, windspeed, and precipitation.

-The pandas describe function shows the minimum attendees is 110 and the maximum is 142,890.

-The OLS linear regression model using month, day, hour, day of week, holiday, temp, temp_wb, rel_humidity, windspeed, and precipitation to predict the number of attendees at the amusement park. The out of sampling R^2 (OSR2) value was calculated as 69.4%.

-A model was built utilizing DecisionTreeRegressor and noted to have a 100% accuracy on the training data. This is a sign of overfitting. The size of the tree model is 11,321 nodes and a depth of 47. The tree model was determined to have an out of sample R^2 value of 77.8% on the test data. The tree model needs to be pruned in order to reduce overfitting.

-The tree model is pruned using cost complexity pruning and the CCP_alphas was 5,185. We would like to generate about 50 trees, so a new list was created by taking every 100th element providing ~51 trees.

-The tree size versus prediction quality (R-squared/OSR-Squared) plot may be found above. The plot shows that the number of nodes (tree size) levels out based on the blue and orange curves.

-The tree with the best OSR2 value is selected and fit to the model showing 751 node count and a max tree depth of 29. The plot above shows the basic classification tree with a 79.7% OSR2 value.


Contact

Please feel free to reach out through the following platforms: