Profile Image
  • Methods: Python
  • Data Analysis: Pandas, Numpy
  • Data Visualization: Matplotlib
  • Data Modeling: sklearn, XGBoost
  • Web Development: HTML, CSS

Analyzing Diabetes with XGBoost

  • The objective of this project is to analyze a diabetes dataset utilizing XGBoost in a python jupyter notebook.
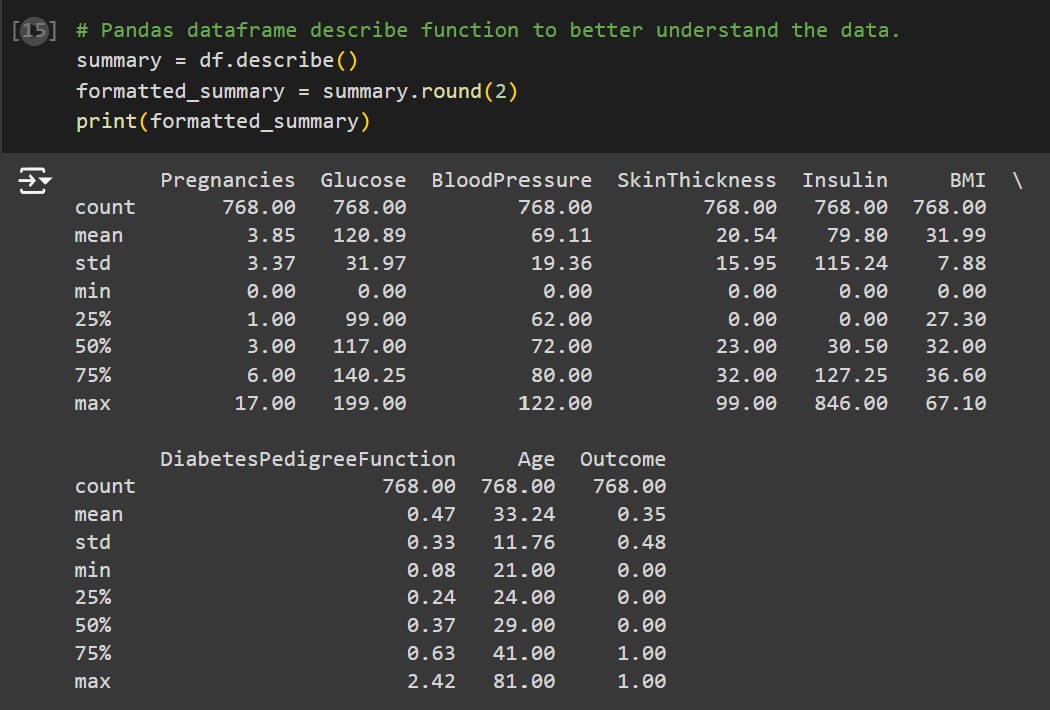
  • This diabetes dataset contains the variables pregnancies, glucose, blood pressure, skin thickness, insulin, BMI, diabetes pedigree function, age, and outcome (binary- positive or negative).
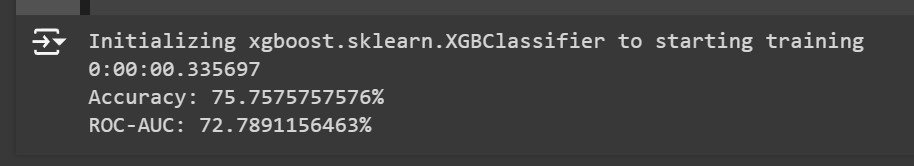
  • XGBoost is an optimized distributed gradient boosting library that can be used to implement machine learning algorithms under the gradient boosting framework. More information can be found here: XGboost.ReadtheDocs.io
  • Tables and Graphs can be found here:
  

Results

The dataset analyzed in this project included 768 entries, which include the variables pregnancies, glucose, blood pressure, skin thickness, insulin, BMI, diabetes pedigree function, age, and outcome (binary- positive or negative).

-The pandas describe function shows the minimum age is 21 and the maximum age is 81 years old.

-The dataset is made up of 34.9% (268) positive and 65.1% (500) negative participants.

-The data was split into 70% (537) training and 30% (231) testing data using sklearn train_test_split.

-A model was built using XGBoost with a learning rate of 0.05, maximum depth of tree 20, minimum loss reduction gamma 10, and number of estimators 500.

-The XGBoost model's accuracy was calculated to be 75.7%, while the Receiver Operating Characteristic Area Under the Curve (ROC-AUC) was 72.8%.

-The feature importance plot shows glucose (41), BMI (30), age (20), diabetes pedigree function (5), and insulin (1).


Contact

Please feel free to reach out through the following platforms: