Profile Image
  • Methods: Python
  • Data Analysis: Pandas, Numpy, PCA
  • Data Visualization: Matplotlib, Plotly, Seaborn, bioinfokit.visuz
  • Data Modeling: Scikit-Learn, K-Means
  • Web Development: HTML, CSS

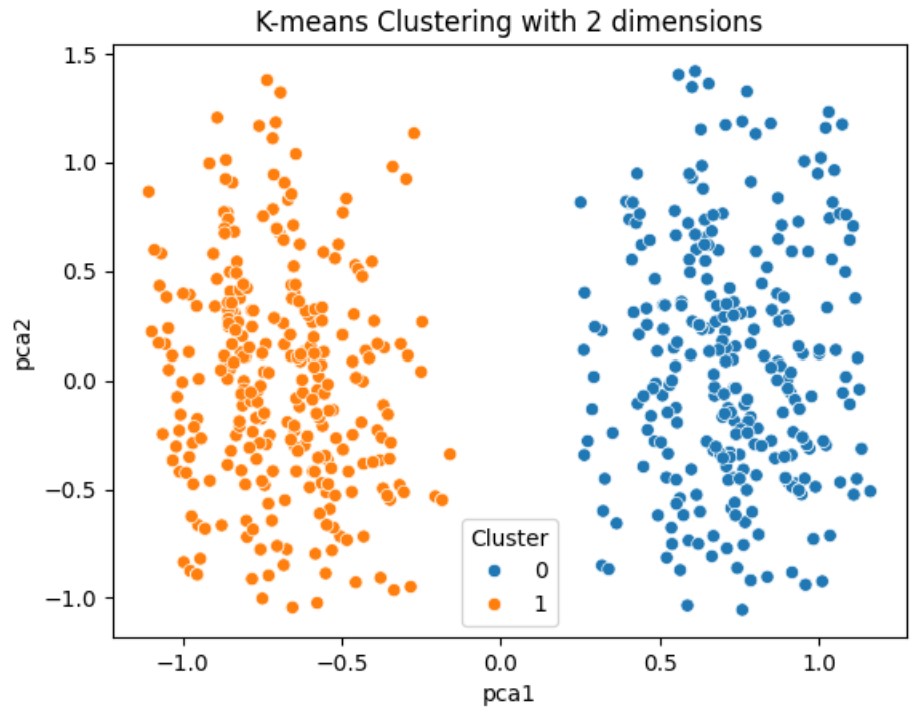
Automobile Survey Clustering, Dendrograms, and Principal Component Analysis

  • The objective of this exercise examines Auto Survey data that contains reviews of different parameters of an automobile. The coding exercise is provided in the python jupyter notebook below.
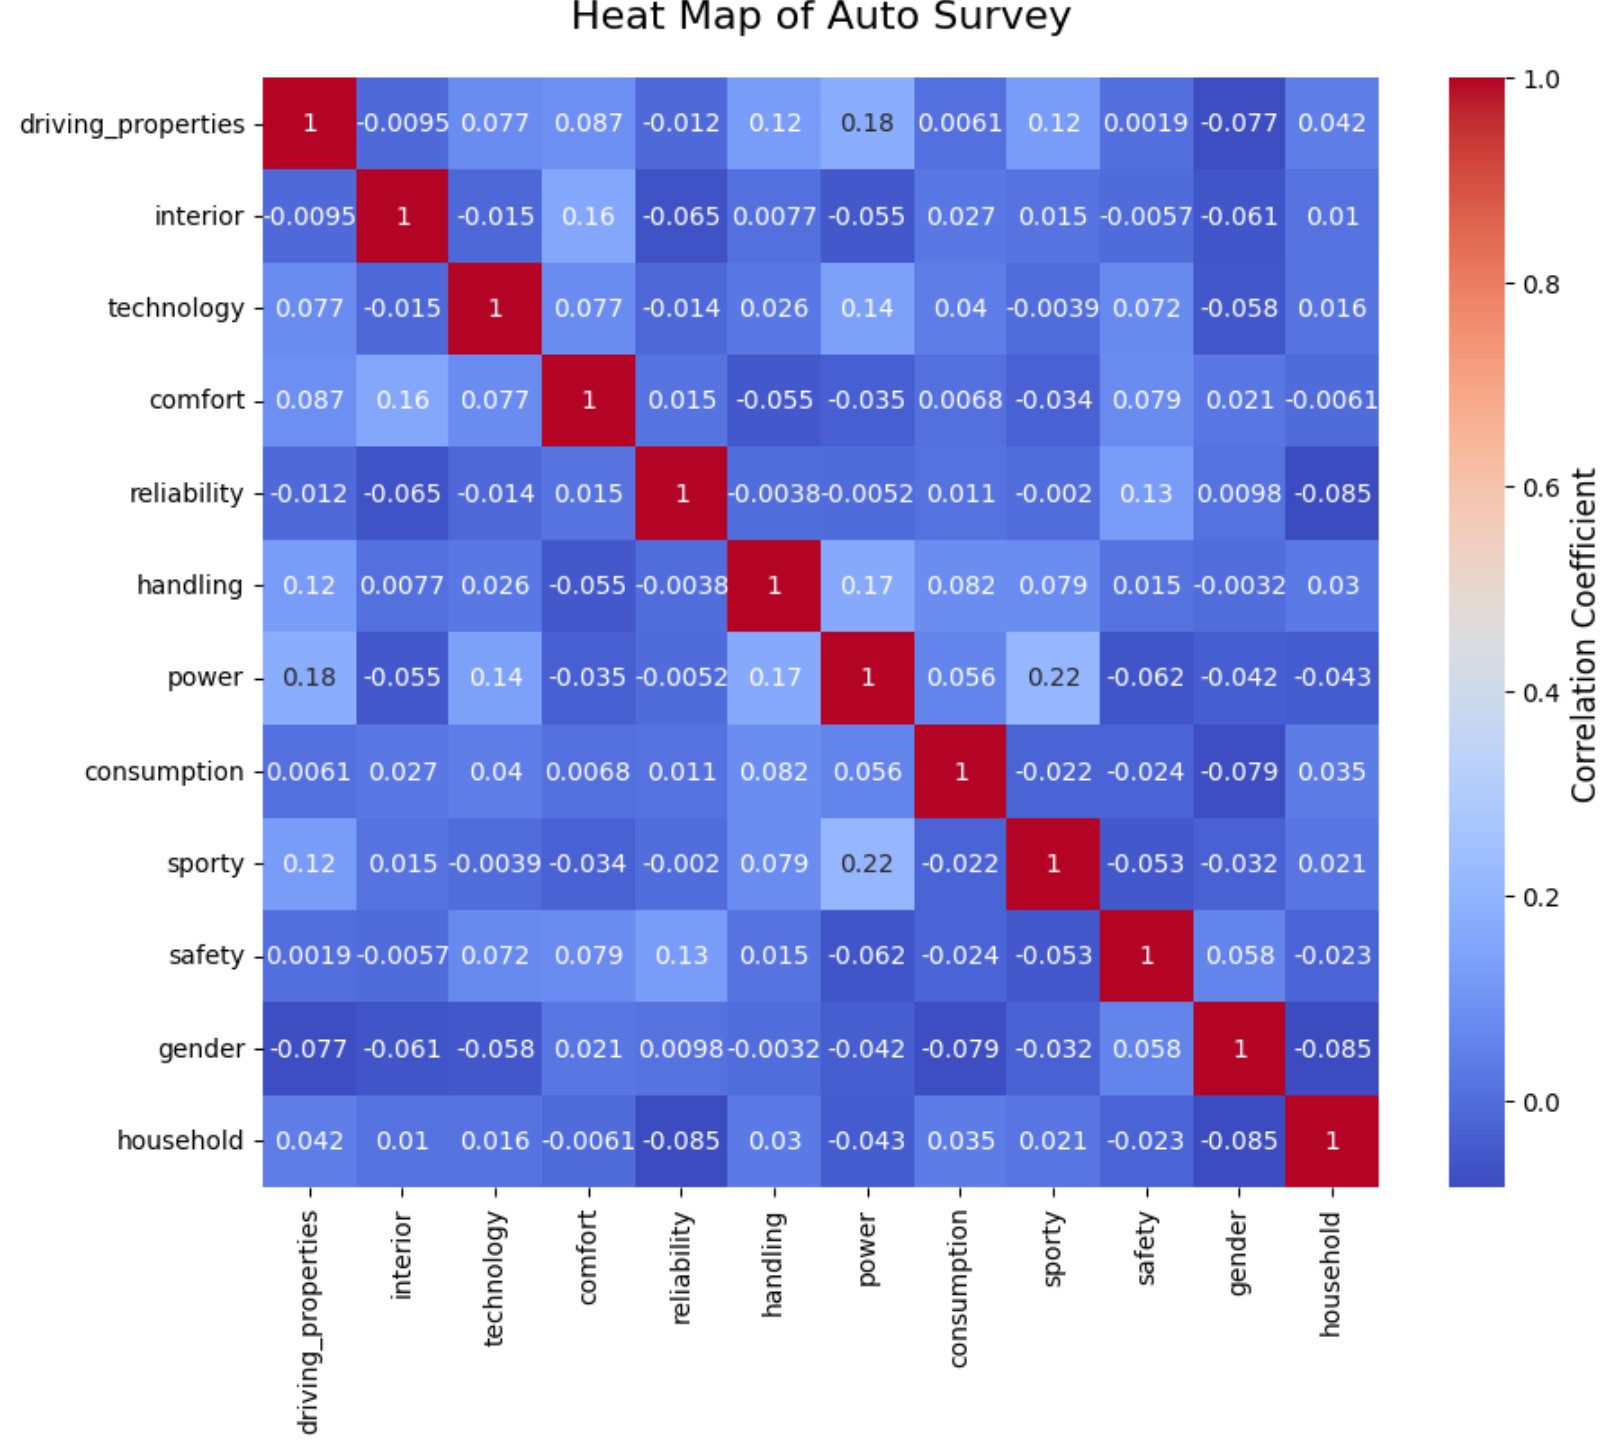
  • The data consists of yes or no questions (1 or 0) for whether the automobile satisfies that category (variable). The variables in this dataset are driving_properties, interior, technology, comfort, reliability, handling, power, consumption, sporty, safety, gender, and household.
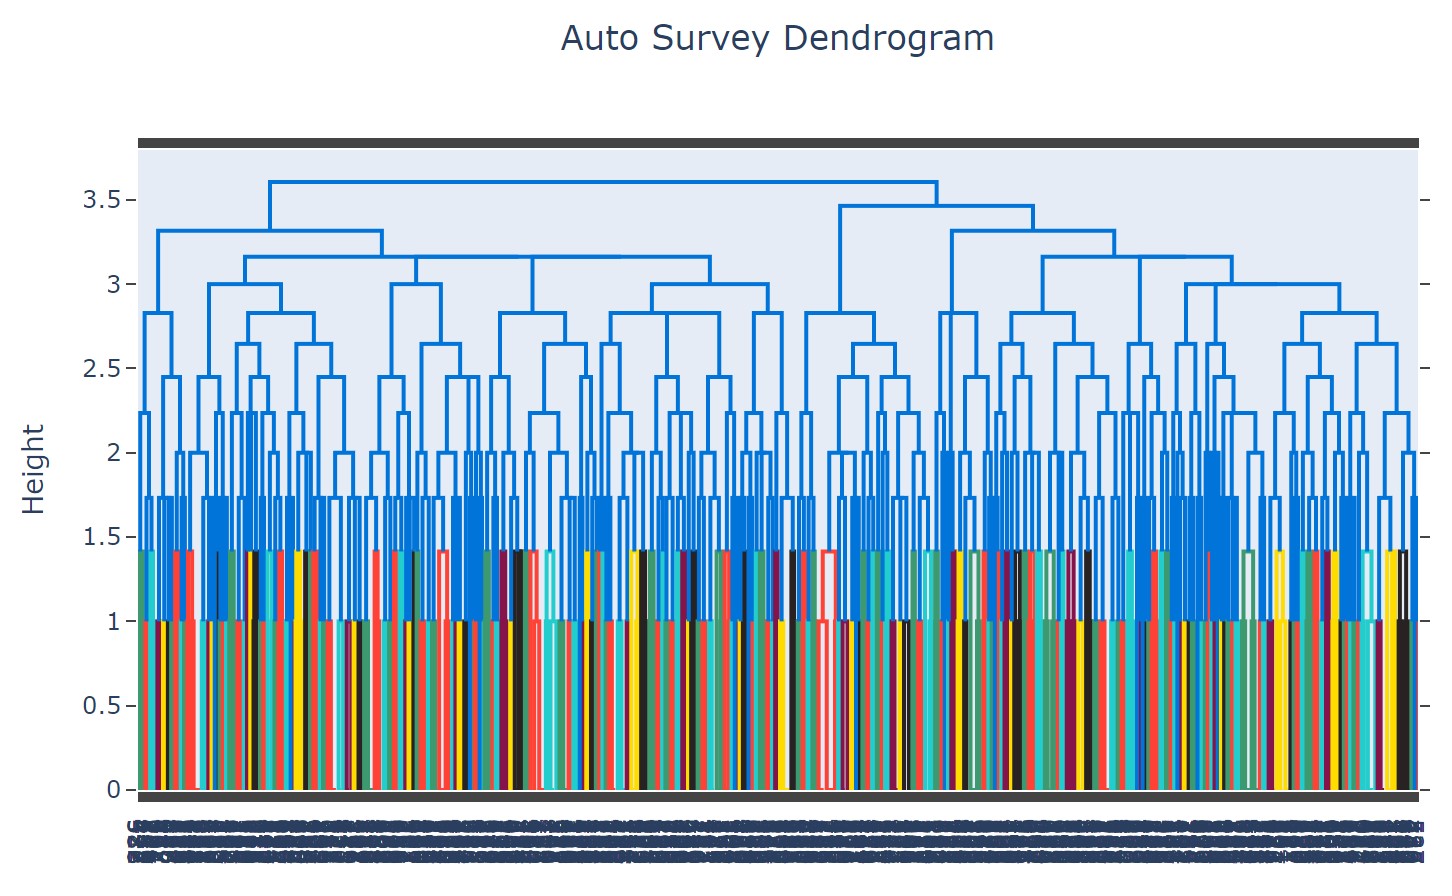
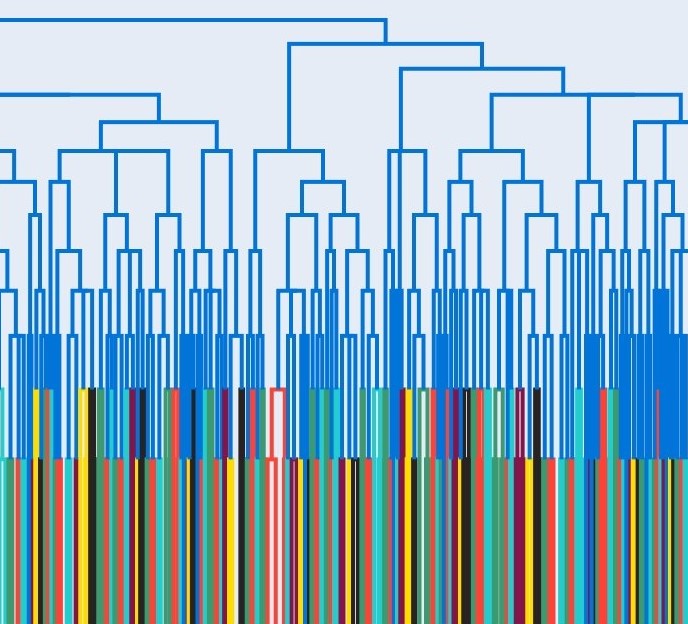
  • Dendrograms is a method of hierarchical clustering. More information can be found here for a general overview of the hierarchical-clustering and here for Scikit-Learn Dendrograms overview.
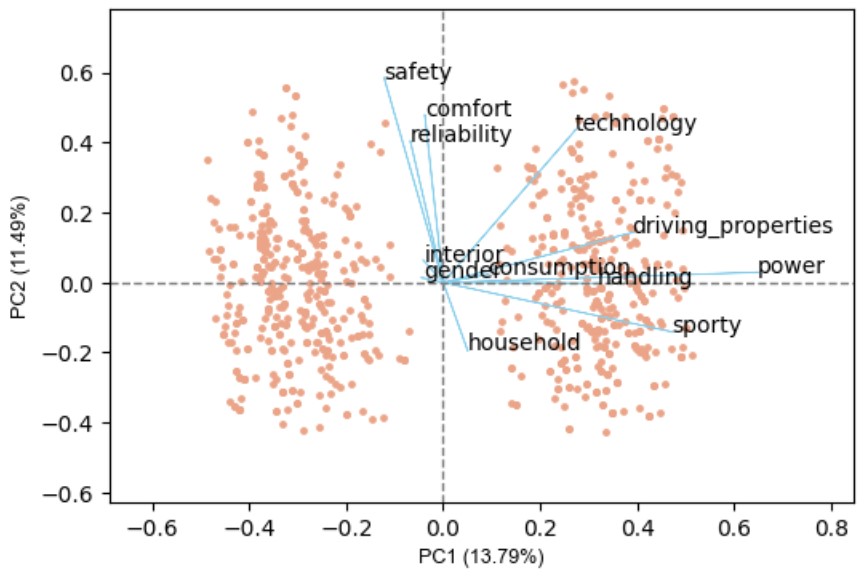
  • Principal Component Analysis (PCA) is a data preprocessing technique used to extract the most informative features, while preserving the most relevant information from the dataset. PCA reduces the model's complexity/dimensionality. More information on PCA can be found here: IBM What is Principal Component Analysis.
  

Results

-The automoble survey data consists of 792 points containing yes or no answers (1 or 0) for whether the automobile satisfies that category (variable). The variables in this dataset are driving_properties, interior, technology, comfort, reliability, handling, power, consumption, sporty, safety, gender, and household.

-Dendrograms and heat maps were created created to provide insight into each parameter. The heat map showed Power is the most correlated feature to "Sporty."

-The k value is the number of clusters for the k-means algorithm. The visual elbow method consists of plotting the k values and corresponding WCSS values over a given range. This exercise used k=2 as the value for the K-means clustering portion. The K-Means clustering showed the Driving Priorities, Technology, and Power features contribute to a customer falling into the same cluster.

-The most important components of the automobile based on the survey were identified through Principal Component Analysis (PCA). PCA is necessary before intrepreting K-means to flatten the three-dimensional data frame to two dimensions to be plotted. Additional information on PCA may be found here: How to read PCA biplots and scree plots by BioTuring Team. The analysis found reliability is more important than comfort. Technology is more important than interior. Most people who took the survey were male.

-Similar data could be processed through this methodology in order to identify similar data points as well as anomalies.


Contact

Please feel free to reach out through the following platforms: